ON THIS PAGE
SmartSpace.ai Workflows & Use Case Setup
Workflows – Using the Debugger
Using the Debugger
Overview
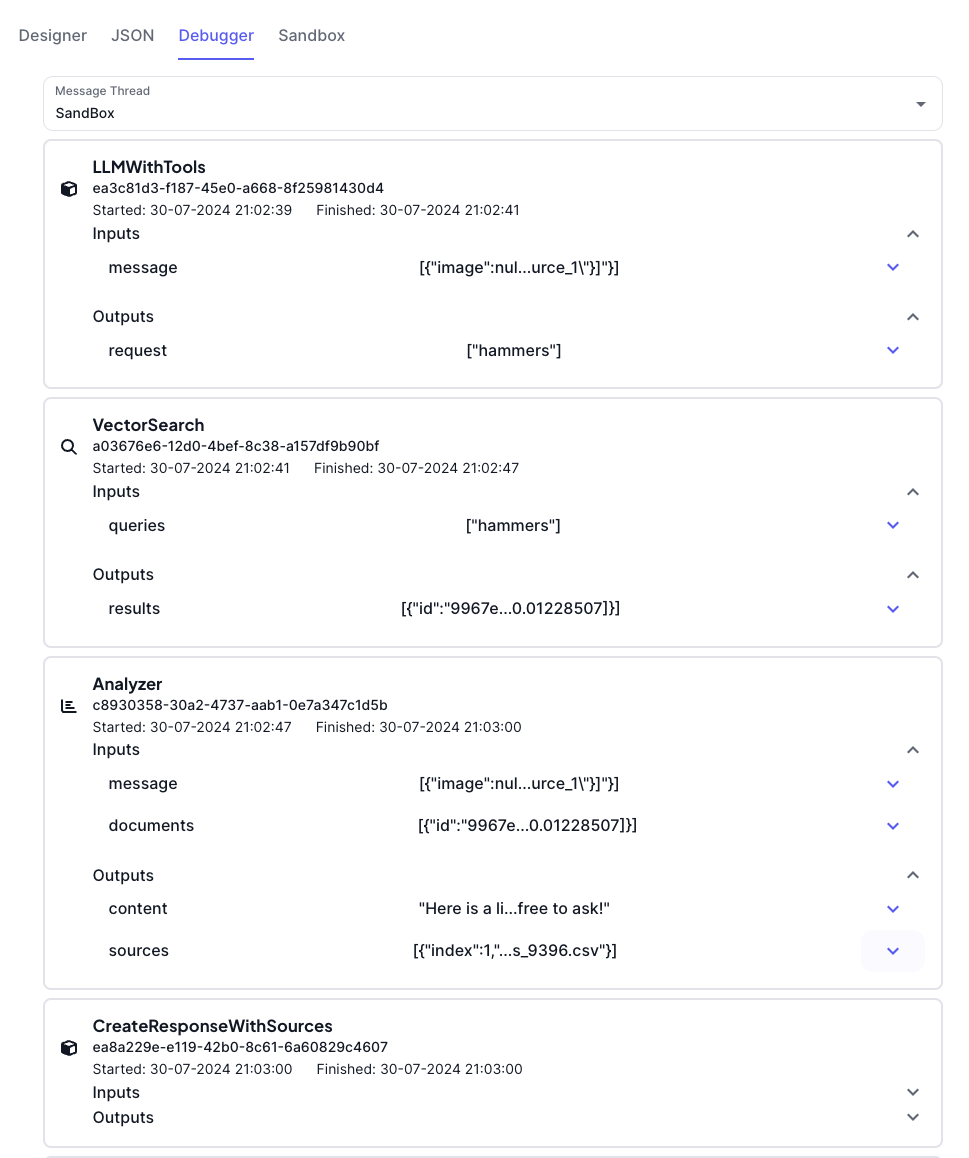
The Debugger in SmartSpace is an essential tool for monitoring and troubleshooting flows within your workspace. It provides detailed logs of each step executed in a flow, showing the inputs received, the processing performed by each block, and the outputs generated. This allows users to understand how their flows are functioning and to identify any issues that might arise.
Accessing the Debugger
The Debugger can be accessed from the SmartSpace interface. Once you have initiated a flow, either by sending a message through the sandbox or triggering an API call, you can view the execution details in the Debugger tab.

Key Features
Message Thread View: The Debugger displays a message thread view that allows you to follow the entire flow of messages. This includes all inputs, outputs, and any errors encountered during the execution.
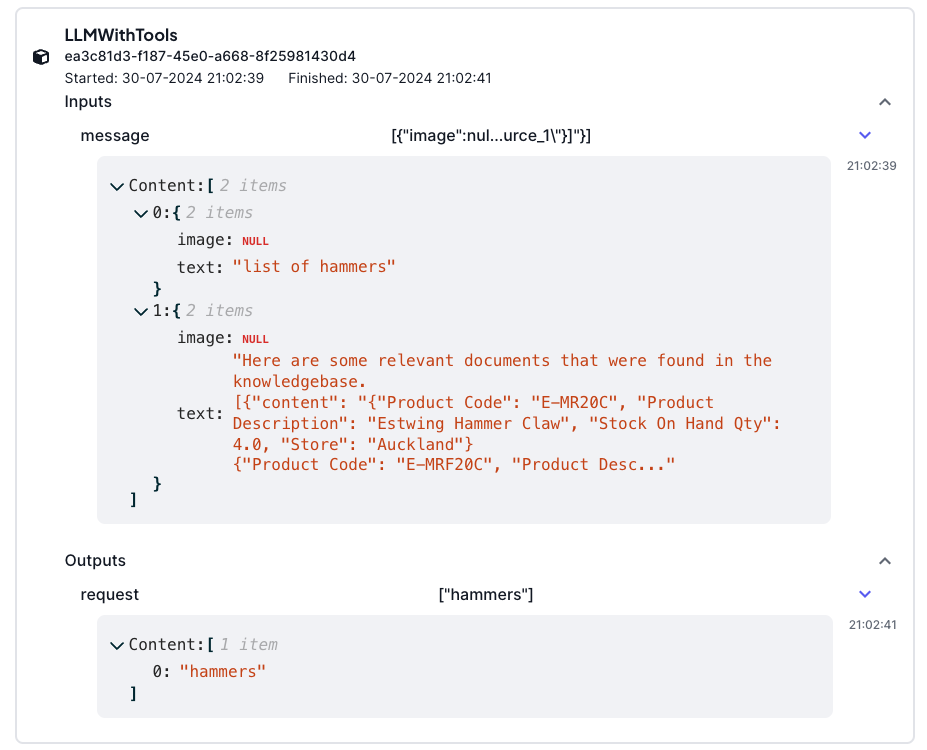
Step-by-Step Logs: Each block in the flow is logged with detailed information, including:
Inputs: What data was received by the block.
Processing: The actions performed by the block.
Outputs: The results or data emitted by the block after processing.
Error Tracking: If any block fails to execute properly, the Debugger will highlight the error, providing details on what went wrong and where it occurred in the flow.
Execution Time: For each block, the Debugger shows the start and finish time, allowing you to track the performance of your flow and identify any potential bottlenecks.

Practical Use Cases
Testing and Validation: Use the Debugger to test new flows or modifications to existing flows. By stepping through the logs, you can validate that each block is functioning as intended and that the overall flow produces the expected results.
Troubleshooting: When a flow doesn’t behave as expected, the Debugger is your first point of call. By examining the logs, you can identify exactly where an issue occurred and what might have caused it, making it easier to fix problems.
Performance Optimization: The execution time data in the Debugger can help you optimize your flows by identifying slow blocks or inefficient paths within your flow.
Best Practices
Regular Monitoring: Even if your flows are running smoothly, it’s good practice to periodically check the Debugger logs to ensure there are no hidden issues.
Detailed Error Handling: Implement robust error handling in your flows so that when an issue arises, the Debugger provides clear and actionable information.
Documenting Changes: Whenever you modify a flow, use the Debugger to verify that the changes work as intended before pushing them into production. Document any changes in your flow’s configuration or logic for future reference.
